In this guide, I’ll explore one of the most popular technical analysis tools: the Tradingview Fibonacci retracement. This is a complete guide to using fib retracement in TradingView. I’ve made this guide as user friendly and helpful as possible. It details how to add the tool to your charts, how to use it correctly and details all the features available with the tool.
Signup for a Essential, Plus+ or Premium TradingView subscription using the link. *New users get $15 towards a new plan.
Table of Contents
- What is a Fibonacci Retracement?
- How to use Fibonacci retracement in TradingView
- Toolbar
- Style Properties
- Coordinates Properties – How to set the precise position of the Fib Retracement?
- Visibility Properties
- How to setup a Fibonacci extension tool Template
- Tradingview Fibonacci extension
- Get the most out of Tradingview tools and features
What is a Fibonacci Retracement?
The Fibonacci retracement tool is based on the works of Mathematician Leonardo Fibonacci. It is a popular are a method for identifying significant support and resistance prices levels.
The key premise of the tool is that price tend to retrace a portion of a trends prior move – it oftentimes retraces to a key ratio (Fibonacci retracement level), before continuing again with the original trend.
Fib retracement levels
The key ratios (23.6%, 38.2%, 61.8%) otherwise known as fib retracement levels can be used to forecast price levels where a stock can potentially: (a) reverse a trend or (b) find support or (c) resistance levels.
A 23.6% is normally considered relatively shallow whereas a retracement to 61.8% is deeper. 61.6% is oftentimes termed the ‘Golden Retracement’ – from Golden ratio – which comes from taking any number in the Fibonacci sequence and divided it by the next number in the sequence. The Golden ratio frequently appears in the natural world.
How to use Fibonacci retracement in TradingView
Tradingview’s Fibonacci retracement tool makes using Fibonacci Retracement easy. This section will demonstrate how to add the Fibonacci retracement tool to your charts and most importantly how to draw a Fibonacci retracement in Tradingview correctly.
Where to find the fib retracement tool in tradingview?
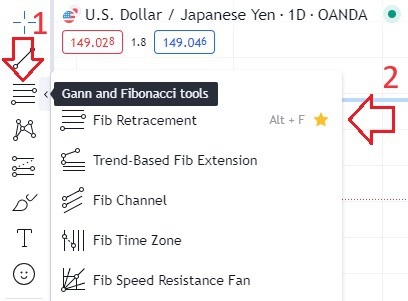
To find the Fibonacci tool in Tradingview. Follow these steps:
- In the tool bar located on the left hand side select Gann and Fibonacci tools icon.
- In the pop up menu select Fib Retracement (See diagram below).
Alternatively use the keyboard shortcut Alt + F
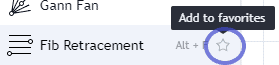
Tip:
If you’d like to add this handy tool in your toolbox, you can label it as one of your favorites by clicking the star button.
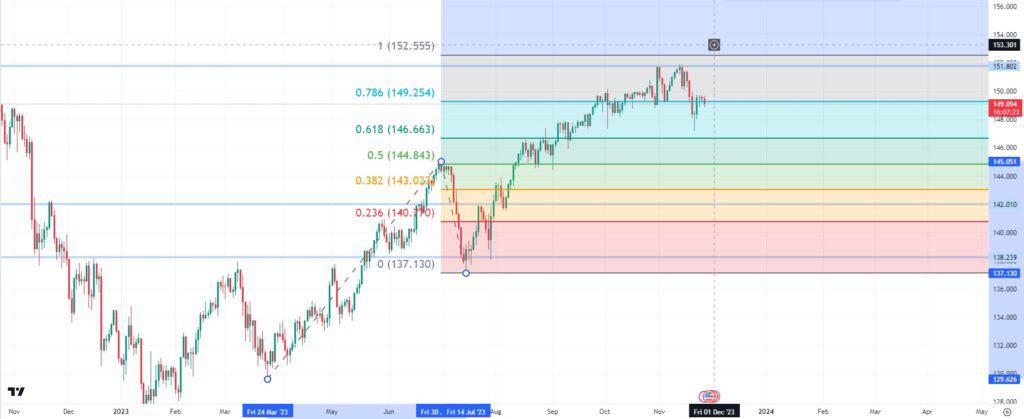
How to draw a Fibonacci retracement in tradingview?
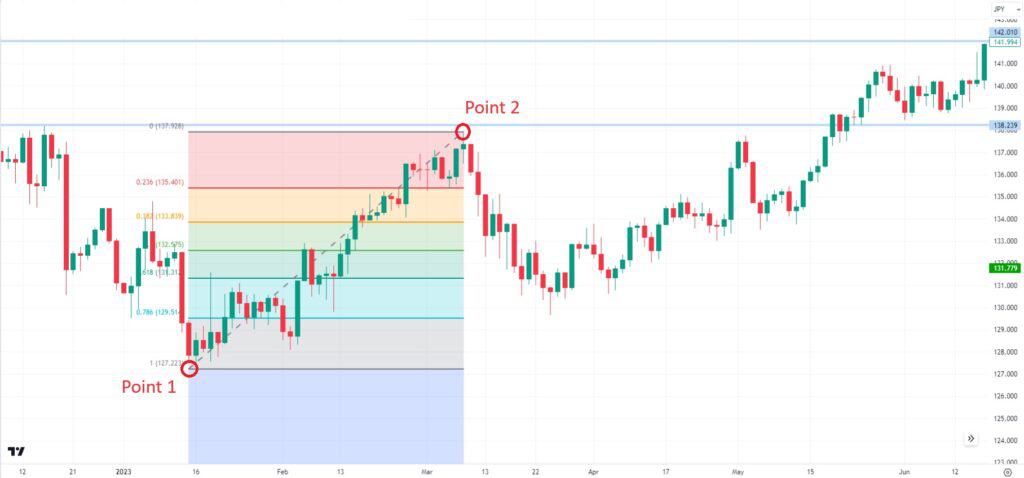
- Identify the big trending move you’d like to use as the basis in determining possible retracement levels.
- Place your cursor at the start of the move (Point 1).
- Once you click on your starting point, the fib levels should appear. Drag the mouse to the end of the move (Point 2). Notice the fib levels expand.
- Click at the trend move end point to set the fib extension tool in place.
- Customize the tool settings. Refer to Toolbar section below.
There you have it! That’s the basic concept of using Fibonacci Retracements on TradingView. Try it yourself!
How to remove the Fibonacci retracement tool from Tradingview
To remove the Fibonacci retracement tool from a Tradingview chart:
- Hover over the Fib retracement tool. Right click and select Remove from the pop up menu.
- Select the Fib retracement on the chart to delete with your mouse. Press Keyboard shortcut DELETE on your keyboard.
Toolbar
The toolbar menu options allows users to make detailed tool customizations to make the tools completely their own.
After drawing your Fib levels, the toolbar will appear automatically. Alternatively, you can double click your drawing.
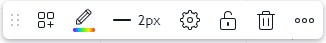
- Templates. This is where you can load your saved templates or create a new template. Refer to the Template section below.
- Line tool colors. This option lets you change the default multi-color Fib levels and background to a single color of your choice.
- Line Tool Width. The line tool allows users to customize line thickness
- SETTINGS. Customize and set tool Style, Coordinates, Visibility options. I go into more detail about each of these in the sections below.
- Lock. Prevent accidental deletion or unwanted modifications.
- Remove. Select remove to delete your drawing.
- Visual Order. There are 4 visual order preferences. Bring to front, send to back, bring forward, send backward.
- Visibility on intervals. Select which time intervals to display tool. Options include: Current interval and above, current interval and below, current interval and All intervals.
- Clone and copy. Clone (keyboard shortcut ‘Ctrl + Drag’) will immediately put the copy as an overlay on your existing drawing. Copy (keyboard shortcut Ctrl + C) also creates a duplicate but is initially copied to your clipboard. You may then choose where you like your drawing located > click paste (Right click for popup menu or Ctrl +V).
- Hide. Clicking hide will make your drawing disappear temporarily. To unhide > right click > click “Object Tree”, a panel will show up on your right showing all the objects on your chart. Click the eye icon. Your drawing will reappear on the same position it was last placed in your chart.
Style Properties
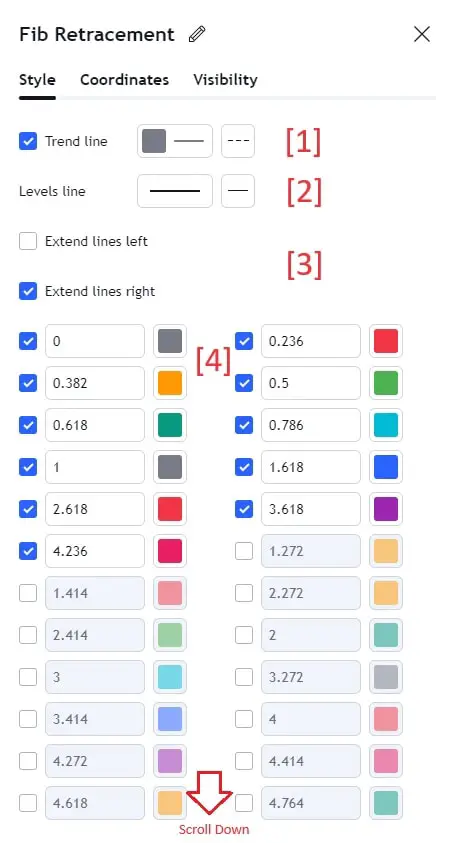
In this section I’ll detail the customizable features available within the settings Style feature. To access the settings menu (Style) see the Toolbar section above
Trend Line [ 1 ] – The trend line, by default settings, is the dotted diagonal line that connects your two critical points.
The trend line has 3 customizable elements:
- Visibility (checkbox): Ticking or unticking this box will make the trend line appear/disappear
- Color, Thickness and Opacity: You can select colors, line thicknesses and opacity level.
- Line type: Choose from different line styles (dotted, dashed, solid)
Levels Line [ 2 ]. Customize the style of the fib extension levels (dotted, dashed, solid). Color selections for individual lines can be made at the bottom of the Style window.
Extend Lines Left / Right [ 3 ]– Instead of manually expanding your fib drawing – ticking the extension box/boxes will automatically extend the level lines in the direction ticked (left or right).
Level fields [ 4 ]. Customize individual extension lines: visibility, level values, and colors. The importance of this feature is to give users the absolute flexibility in setting up their own Fibonacci Retracement template; filtering out unwanted levels or adding your own key ratio while customizing line color.
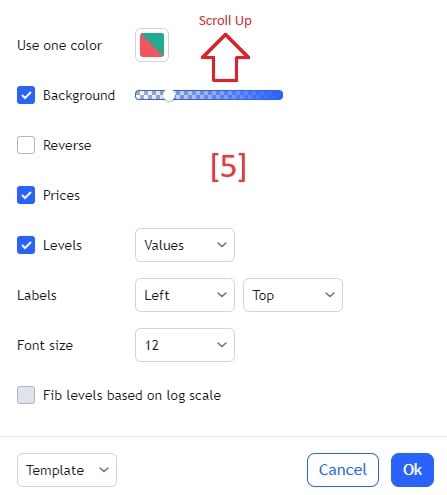
Other Style features include [ 5 ]: Background selection, Reverse the extension, labeling options such as including price data, label positions and font sizes.
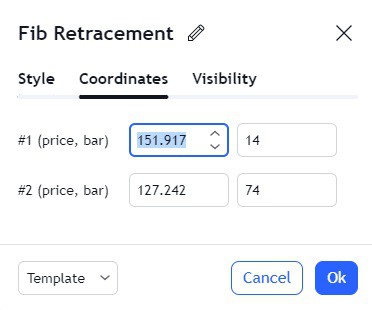
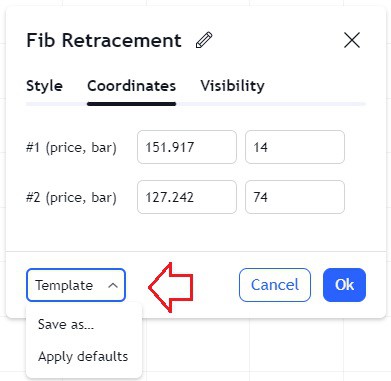
Coordinates Properties – How to set the precise position of the Fib Retracement?
The Coordinates features allows users to precisely select the start and end points for setting up the tool on the chart.
- #1 (Price, Bar) represents the START point for the extension trendline
- #2 (Price, Bar) represents the END point for the extension trendline
To set the coordinates for each of these follow these steps:
- Set the Price value (Y axis) in the left field.
- Set the Time value (Bar number) (X-Axis) in the right field.
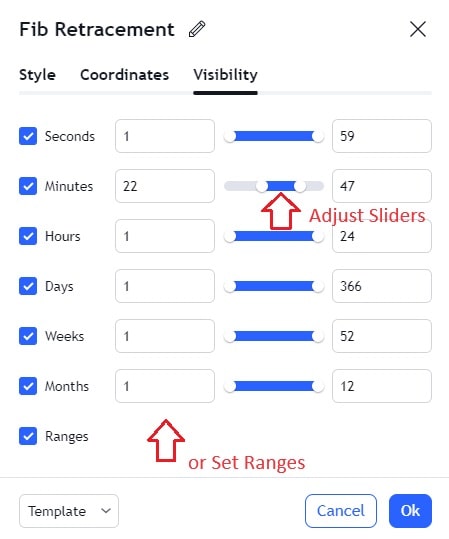
Visibility Properties
Visibility properties allow users to configure the tool by selecting all or specific time frames that the tool will appear.
To find the visibility customization options go to SETTINGS (See Toolbar section above).
Visibility Filter: To make your drawing appear on a timeframe, tick the respective checkbox and use the slider to set the value range. To make it disappear, simply untick or limit the value range.
How to setup a Fibonacci extension tool Template
After adjusting your preferences, Tradingview allows users to save preferred settings to a template. Templates allow uses to set specific named templated for easy retrieval.
There are two ways to save a template in Tradingview. Either via the settings menu (See toolbar section above) or via the chart tool right click menu. I’ll describe each of these below:
Via Settings menu in Toolbar. In the settings window bottom left hand corner. Select the Template drop down menu.
- Click “Save Drawing Template As” to save your tool settings.
- Select “Apply Default Drawing Template” to revert to default TradingView settings.
- Click on your pre-saved template to retrieve a template.
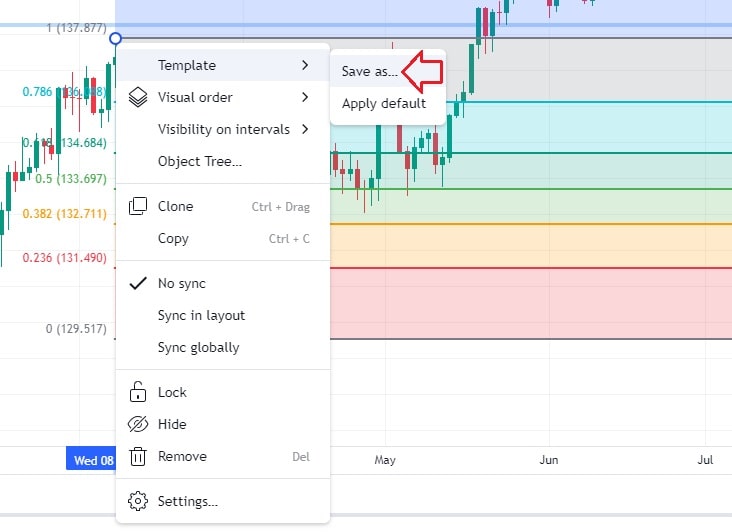
Right Click Dropdown Menu. You can also access the Template option when you right click your chart tool. A dropdown menu will appear and you will see Template at the top.
Tradingview Fibonacci extension
The Fibonacci Extension tool is designed to forecast trend continuation after a retracement. Extension levels are based on Fibonacci key ratios.
Using the Tradingview Fibonacci extension tool is almost identical to the retracement tool. Settings and menu options are the same as the retracement tool I’ve detailed above.
Tradingview Fibonacci extension tool measures the Fibonacci ratio of a retracement after a trending move (Left hand side of tool – see figure below).
It can then be used to predict the size of the trend continuation move as a ration of the previous trend leg.
It can is useful as an method for placing take profit orders.
Get the most out of Tradingview tools and features
Tradingview offers loads of user friendly tools and features. To get the most out of the platform consider signing up for a free tradingview trial or upgrading to a Essential, Plus or Premium account.
Signup for a Essential, Plus+ or Premium TradingView subscription using the link. *New users get $15 towards a new plan.